Prestressed Concrete Price Trends: Estimator Guide for Bids
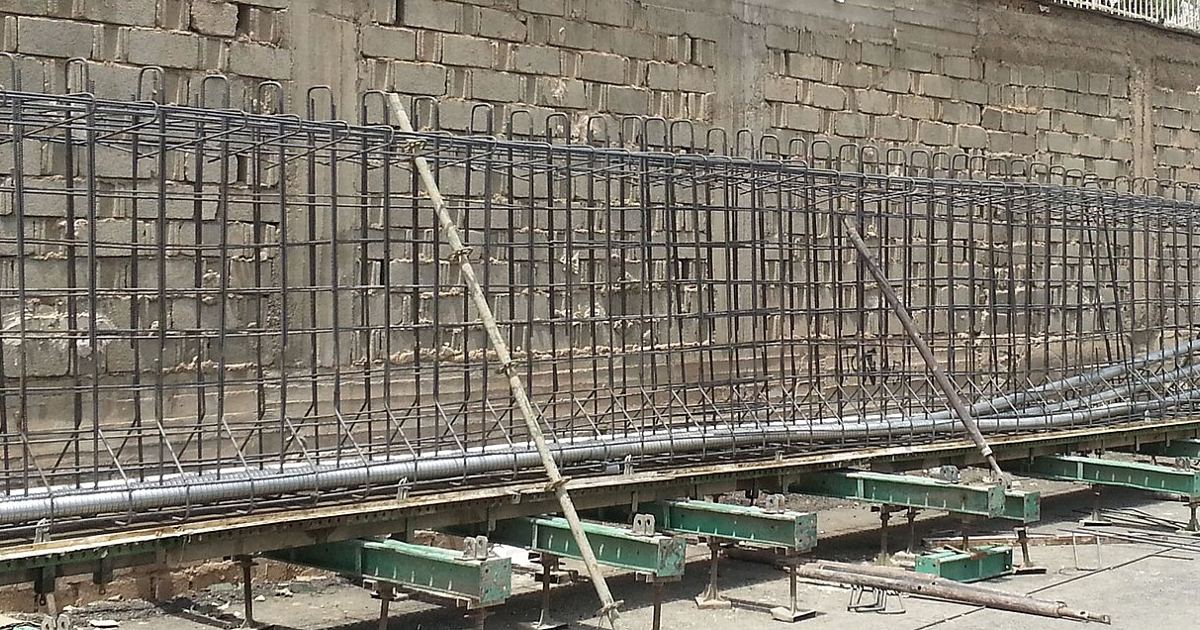
Pricing structural packages for bridges, parking decks, and elevated transport facilities requires balancing fabricator lead times against moving material costs. Estimators comparing today's marketplace to historic cost benchmarks rely on producer price index numbers to gauge whether structural components are continuing an upward climb or settling into a plateau. This comparison guide evaluates the nonmetallic mineral products pricing track to help trade contractors and general contractors manage bid exposure.
Comparing Long-Term Benchmarks: Pre-Pandemic to 2026
When measuring multi-year shifts in structural concrete components, the gap between pre-pandemic baselines and present-day levels remains substantial. According to data tracked by the U.S. Bureau of Labor Statistics PPI commodity data series WPU1335, the index for prestressed concrete products stood at 238.8 in January 2020. By September 2026, that figure climbed to 376.9, marking an overall change of +57.8% relative to the early 2020 benchmark.
Looking at a five-year horizon reveals a similar dynamic. In September 2021, the index registered at 261.5. Comparing September 2021 directly to the September 2026 value of 376.9 shows an increase of +44.1%. Estimators who rely on cost models built during the 2020 or 2021 building seasons without recalibrating for this multi-year climb risk significantly underestimating supplier quotes on double-tee beams, bridge girders, and precast panels.
Comparing Short-Term Horizons: 2024 Through 2026
While the five-year trajectory reflects steep upward movement, shorter time windows show that recent price growth has been more measured. Comparing recent intervals reveals the following trend lines:
- Two-year movement: In September 2024, the index stood at 363.9. Moving from September 2024 to September 2026 reflects a change of +3.6%.
- One-year movement: In September 2025, the index stood at 368.1. The advance from September 2025 to September 2026 represents a change of +2.4%.
- Month-over-month movement: The index registered at 376.9 in August 2026 and held at 376.9 in September 2026, representing a month-over-month change of +0.0%.
Examining the 13 months leading up to September 2026 shows extended stretches of pricing stability interrupted by mid-year steps. From September 2025 through December 2025, the index held flat at 368.1 each month. Moderate upward adjustments appeared in January 2026 at 368.3 and February 2026 at 368.6, before jumping to 373.2 in March 2026. Incremental changes followed through spring and summer: 373.6 in April, 374.8 in May, 375.8 in June, 376.5 in July, and finally reaching 376.9 in August 2026.
Annual Average Comparisons Across the Decade
A broader perspective emerges when comparing full-year index averages across the historical window. In 2017, the annual average stood at 220.1, with the absolute window low recorded in February 2017 at 217.0. Annual averages rose gradually to 228.2 in 2018, 233.7 in 2019, and 237.6 in 2020. The market began accelerating in 2021 with an annual average of 255.9, followed by a sharp increase to 321.4 in 2022 and 357.8 in 2023.
More recent annual comparisons indicate a decelerating growth rate. The annual average rose to 365.3 in 2024 and 366.1 in 2025. For the January through September period of 2026, the calculated average stands at 373.8. The highest single monthly reading across the entire January 2017 to September 2026 period occurred in August 2026 at 376.9 (raw 376.871), matched by September 2026 at 376.9.
Index Milestone Reference Table
Estimators comparing specific contract periods against official benchmarks can utilize the key values below, drawn directly from the U.S. Bureau of Labor Statistics.
| Benchmark Period | Index Value | Change to Latest (September 2026) |
|---|---|---|
| September 2026 (Latest Month) | 376.9 | +0.0% |
| September 2025 (One Year Earlier) | 368.1 | +2.4% |
| September 2021 (Five Years Earlier) | 261.5 | +44.1% |
| January 2020 (Pre-Pandemic Level) | 238.8 | +57.8% |
| August 2026 (Window High) | 376.9 | +0.0% |
Structuring Bids for Heavy Structural Deliveries
Because prestressed concrete components are manufactured off-site and require dedicated yard space, trucking, and crane placement, estimators must account for the time lag between bid submission and product delivery. Several operational considerations apply when pricing these scopes:
- Account for preliminary data windows: Figures published for recent months remain preliminary and subject to monthly revisions for four months under standard BLS publishing schedules.
- Mitigate procurement delays: Fabricators on bridge and parking deck projects often lock pricing for a limited window. Integrating tailored price escalation clauses indexed to specific commodity series protects against unforeseen mid-procurement cost jumps.
- Evaluate risk allowances: When long lead times prevent fixed supplier commitments, estimators often review project estimating contingency allocations rather than absorbing uncertain structural cost increases into baseline trade margins.
Sources
Data referenced in this guide originates from the following government source:
Published October 30, 2026. No affiliate links on this page. Facts come from the sources linked above; check them for updates.