Switchgear and Industrial Controls PPI: A Guide for Electrical Bids
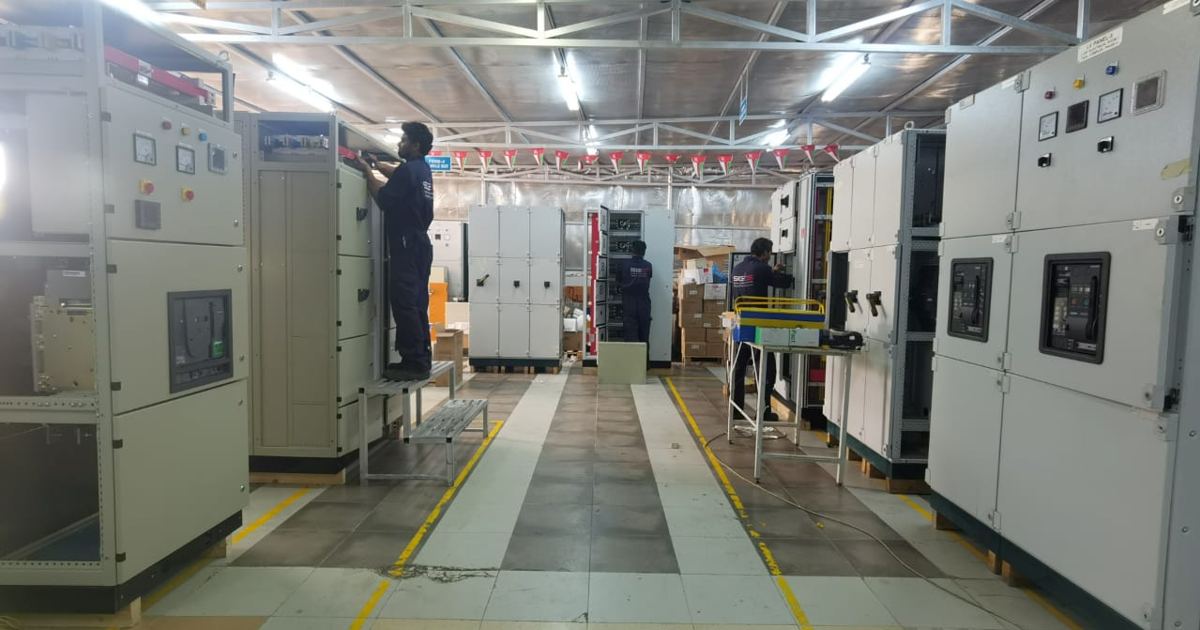
Estimators and commercial contractors pricing electrical gear face a challenging market. Heavy electrical distribution equipment, including switchgear, switchboards, and motor control centers, requires careful indexing when building long-range estimates. Using verified government data from the U.S. Bureau of Labor Statistics PPI commodity series WPU1175, estimators can objectively assess cost trends and protect project margins against persistent inflation.
Step 1: Identify the Government Commodity Benchmark
To establish defensible pricing for electrical gear, estimators must look beyond standard distributor lists and track domestic producer prices at the factory door. The Bureau of Labor Statistics tracks these factory-gate prices through commodity code WPU1175, officially designated as Machinery and equipment-Switchgear, switchboard, industrial controls equipment. This series uses a base period of 1982 = 100 and reports figures that are not seasonally adjusted.
Because major distribution equipment involves significant manufacturing lead times, published figures serve as a critical reference point when evaluating trade packages or preparing general conditions budgets. Utilizing an independent government index helps teams establish a mutually agreed-upon baseline when negotiating contract terms with project owners and general contractors.
Step 2: Examine Multi-Year Price Trends
A reliable estimate requires understanding how current pricing compares to historical baselines. Over the multi-year tracking window from January 2017 to September 2026, switchgear and control equipment prices have climbed dramatically. The lowest monthly value recorded during this entire timeframe was 219.1 in January 2017. By contrast, the index reached its peak of 433.6 in September 2026.
Looking at annual averages shows a sustained upward climb:
- 2017 annual average: 220.7
- 2018 annual average: 225.0
- 2019 annual average: 231.2
- 2020 annual average: 235.7
- 2021 annual average: 246.7
- 2022 annual average: 293.3
- 2023 annual average: 321.6
- 2024 annual average: 343.3
- 2025 annual average: 374.7
- 2026 average through September: 412.9
Before the pandemic disruptions of early 2020, the index stood at 235.3 in January 2020. The September 2026 index level of 433.6 represents an 84.3% increase compared to that pre-pandemic marker. Even across the five-year span from September 2021, when the index sat at 254.6, costs have jumped 70.3%. Over a two-year horizon from September 2024, when the reading was 347.3, prices advanced 24.8%.
Step 3: Review the Benchmark Data Table
The table below presents the core benchmark figures from the federal government for evaluating switchgear and industrial controls pricing across key project milestones.
| Time Horizon | Reference Month | Index Level | Change to September 2026 |
|---|---|---|---|
| Latest Available Month | September 2026 | 433.6 | +0.0% |
| One Year Earlier | September 2025 | 385.9 | +12.4% |
| Two Years Earlier | September 2024 | 347.3 | +24.8% |
| Five Years Earlier | September 2021 | 254.6 | +70.3% |
| Pre-Pandemic Level | January 2020 | 235.3 | +84.3% |
| 10-Year Window High | September 2026 | 433.6 | +0.0% |
| 10-Year Window Low | January 2017 | 219.1 | N/A |
Step 4: Analyze Recent Monthly Trajectories
A closer look at the thirteen months from September 2025 through September 2026 reveals continuous upward pressure rather than a plateau. In September 2025, the index registered at 385.9. Values remained flat in the final quarter of that year, registering 385.8 in October 2025 and 385.7 in November 2025, before stepping up to 390.6 in December 2025.
Throughout 2026, increases accelerated. The monthly figures progressed from 395.7 in January 2026 to 398.2 in February 2026 and 400.0 in March 2026. A sharp rise occurred in the spring, jumping to 412.9 in April 2026, holding steady at 413.2 in both May 2026 and June 2026, and then climbing to 420.2 in July 2026. Price gains continued with a reading of 429.3 in August 2026 and reached 433.6 in September 2026. That last step represented a month-over-month increase of 1.0% between August 2026 and September 2026, pushing the overall twelve-month gain from September 2025 to September 2026 to 12.4%.
Step 5: Implement Escalation Clauses in Subcontract Bids
Given that switchgear pricing has risen 12.4% in a single year, electrical contractors cannot afford to hold firm pricing on extended procurement cycles without formal protection. Estimators should incorporate structured terms using price escalation clauses tied directly to commodity series WPU1175.
Drafting clear terms requires clear scope definitions. Include defined vendor quotation validity windows in your proposal and reference specific bid exclusions and clarifications stating that package prices reflect current index levels. If equipment delivery occurs months after bid award, the escalation clause should adjust billing based on the percentage change in the index between the proposal submission date and the approved factory order date.
Step 6: Account for Preliminary Data and BLS Revisions
When applying index figures to contract billing or equitable adjustments, estimators must recognize how the government publishes and refines its statistics. As noted in the Bureau of Labor Statistics commodity database, recent monthly values are published as preliminary and remain subject to revision for four months after initial release.
For example, the September 2026 value of 433.6 is preliminary. Contracts referencing this index should establish whether billing reconciliations occur immediately upon initial publication or wait until figures become final after the four-month revision window. Specifying this administrative mechanic upfront eliminates payment disputes between trade contractors, construction managers, and owners.
Sources
Published October 31, 2026. No affiliate links on this page. Facts come from the sources linked above; check them for updates.