Metal Products PPI Comparison: Trends for Framing and Steel Bids
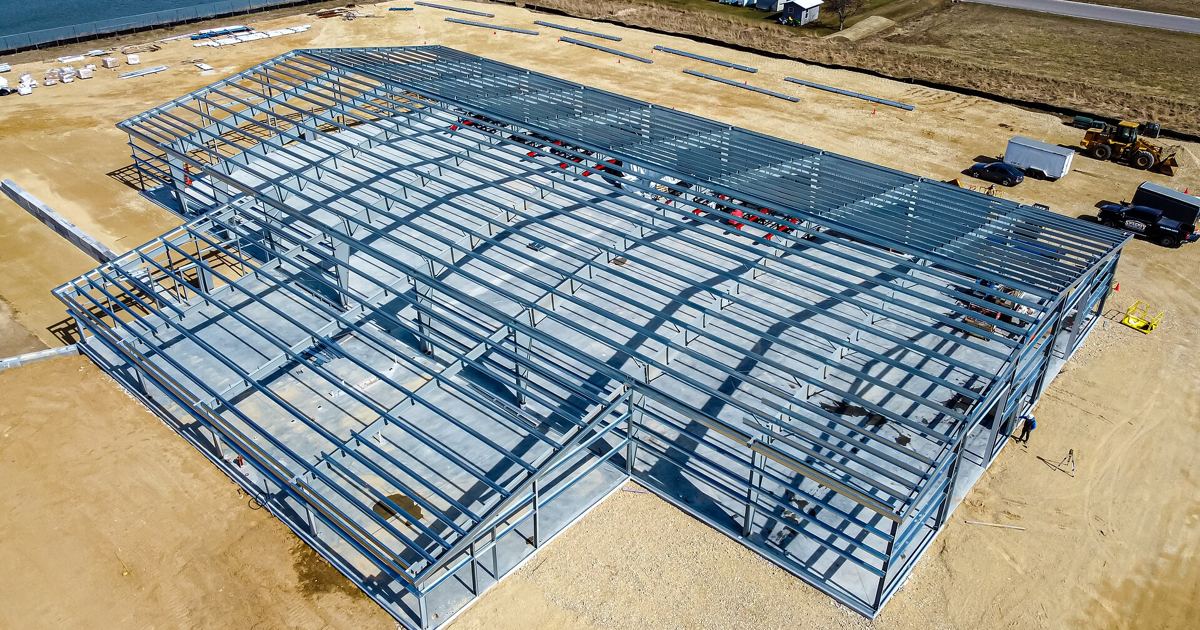
Estimating commercial interior framing, miscellaneous metals, and pre-engineered assemblies requires a clear view of market pricing shifts. As of late October 2026, estimators pricing jobs that include cold-formed steel framing, architectural trim, or fabricated assemblies must evaluate how current commodity index levels compare with historical cycles before locking in numbers.
Comparing Historical Baselines to Current Metal Index Levels
To evaluate whether present supplier quotes reflect temporary shifts or broader baseline increases, estimators can track commodity data reported by the U.S. Bureau of Labor Statistics. Under series WPU1074, which measures structural, architectural, and pre-engineered metal products, the index base period is 1982 = 100 with figures not seasonally adjusted.
In September 2026, the index reached 394.2 (raw value 394.189). Comparing this figure against prior intervals reveals how pricing has accumulated across different market phases:
- Pre-pandemic baseline: In January 2020, the index stood at 229.1 (raw 229.100). The September 2026 level represents a 72.1% increase over that pre-pandemic marker.
- Five-year comparison: In September 2021, the index was 330.1 (raw 330.116). The September 2026 reading is 19.4% higher than five years earlier.
- Two-year comparison: In September 2024, the index stood at 341.7 (raw 341.707), marking a 15.4% increase to the September 2026 value.
- One-year comparison: In September 2025, the series registered 367.0 (raw 366.976), showing that prices climbed 7.4% over the following twelve months.
Across the entire data window spanning January 2017 to September 2026, the lowest monthly value recorded was 209.3 (raw 209.300) in January 2017. The highest monthly value across the entire window occurred in September 2026 at 394.2, meaning current levels represent the peak of this timeline with a 0.0% difference from the period high.
Benchmark Comparison Table: Series WPU1074
When compiling bid proposals or coordinating with suppliers, estimators can benchmark current values against earlier reference points using the summary table below.
| Reference Period | PPI Value (1982=100) | Raw Value | Change to September 2026 |
|---|---|---|---|
| Latest Month (September 2026) | 394.2 | 394.189 | 0.0% |
| One Year Earlier (September 2025) | 367.0 | 366.976 | +7.4% |
| Two Years Earlier (September 2024) | 341.7 | 341.707 | +15.4% |
| Five Years Earlier (September 2021) | 330.1 | 330.116 | +19.4% |
| Pre-Pandemic (January 2020) | 229.1 | 229.100 | +72.1% |
| Window Low (January 2017) | 209.3 | 209.300 | N/A |
| Window High (September 2026) | 394.2 | 394.189 | 0.0% |
Annual Average Trends Across the Ten-Year Window
Reviewing computed annual averages shows how cost structures transitioned between stability, rapid inflation, and subsequent stabilization. In 2017, the annual average was 212.0, followed by 229.3 in 2018 and 233.1 in 2019. The annual average held steady through 2020 at 229.6 before jumping substantially.
In 2021, the annual average reached 296.6, climbing further in 2022 to an annual average of 372.3. The market then experienced consecutive annual declines, dropping to 361.5 in 2023 and 346.8 in 2024. However, that downward movement reversed in 2025 with an annual average of 363.1. Through the first nine months of 2026 (January through September), the computed average stands at 381.8.
Month-by-Month Comparisons Over the Past 13 Months
Estimators tracking short-term supplier commitments need to understand month-to-month momentum. Over the thirteen-month period leading into the fourth quarter of 2026, the series behaved as follows:
- September 2025: 367.0
- October 2025: 369.7
- November 2025: 372.8
- December 2025: 372.8
- January 2026: 373.8
- February 2026: 378.7
- March 2026: 380.1
- April 2026: 379.6
- May 2026: 377.8
- June 2026: 380.4
- July 2026: 383.6
- August 2026: 387.6
- September 2026: 394.2
Between August 2026 and September 2026, the index registered a single-month increase of 1.7%. Estimators should also note that BLS commodity values for recent months remain preliminary and are subject to revision for four months after initial release.
Applying PPI Data to Metal Stud and Steel Estimates
For drywall and framing contractors completing a metal stud framing takeoff, these figures demonstrate that product costs are sitting at their highest recorded level in the 2017 to 2026 window. A proposal based on 2024 pricing averages (346.8) leaves an estimate exposed to a major cost difference compared to September 2026 (394.2).
When quotes must hold for extended durations, contractors frequently incorporate price escalation clauses tied to recognized federal indexes. Referencing specific commodities from the U.S. Bureau of Labor Statistics provides both general contractors and trade subcontractors with an objective standard for tracking cost movement over the life of long-lead submittals and fabrication schedules.
Sources
U.S. Bureau of Labor Statistics: Series WPU1074 Commodity Data
Published October 30, 2026. No affiliate links on this page. Facts come from the sources linked above; check them for updates.