Steel Pipe and Tube Price Trends: Bid-Day Estimating Checklist
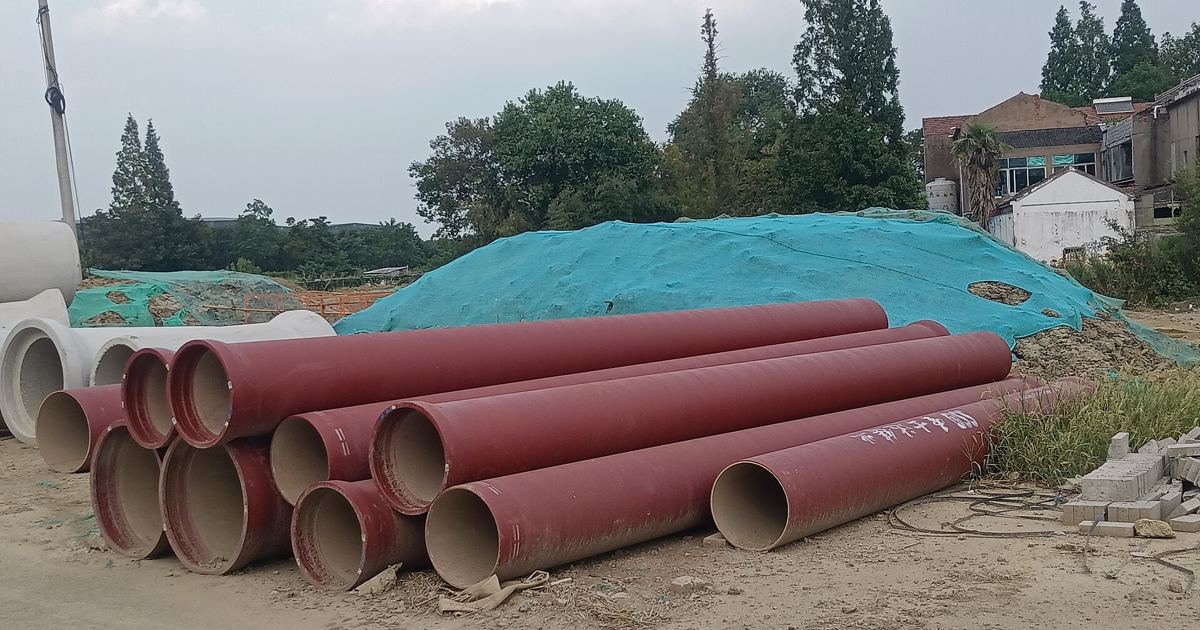
Pricing structural tube framing, handrails, mechanical piping supports, and hollow structural sections requires up-to-date commodity benchmarks when final numbers roll in on bid day. Using producer price data from the federal government helps estimators determine whether supplier quotes reflect broader national shifts or short-term local vendor markups.
Checklist Step 1: Benchmark Supplier Quotes Against Recent PPI Movements
Before plugging supplier numbers into your bid summary, compare distributor pricing against the latest U.S. Bureau of Labor Statistics Producer Price Index for Steel Pipe and Tube (series WPU101706). Steel pipe and tube prices rose steadily through the first three quarters of 2026, reaching an index level of 431.7 in September 2026. That marks a 0.6% monthly increase from August 2026, when the index stood at 429.1.
Over a full twelve-month span, costs have climbed substantially. In September 2025, the index was 381.3, meaning steel pipe and tube input prices increased by 13.2% over that single-year timeframe. If your historical database relies on late-2024 pricing, the gap is wider: the September 2024 index was 360.0, representing a 19.9% climb to the September 2026 level. Run through your takeoff line items to verify your material unit rates reflect this upward momentum rather than older baseline numbers.
Checklist Step 2: Review Long-Term Escalation and Historical Peaks
Estimators pricing multi-year contracts or tracking overall metal inflation must also contextualize current figures against long-term historical extremes:
- Pre-pandemic baseline: In January 2020, the steel pipe and tube index stood at 270.3. The September 2026 level of 431.7 represents a 59.7% net increase above that pre-pandemic marker.
- Historical high in the data window: The peak across the January 2017 to September 2026 window occurred in June 2022 at an index reading of 508.7. September 2026 sits 15.1% below that all-time high.
- Historical low in the data window: The lowest monthly reading across the window was 229.8 in January 2017.
- Five-year comparison: In September 2021, the index was 438.5, placing September 2026 about 1.5% below where prices stood five years prior.
Annual averages underline this cycle. The index averaged 245.1 in 2017, 280.6 in 2018, 281.7 in 2019, and 267.1 in 2020. It jumped to 387.1 in 2021 and peaked at an annual average of 491.3 in 2022. Costs moderated to 407.0 in 2023, 372.2 in 2024, and 376.1 in 2025. Across January through September of 2026, the average climbed back to 410.5.
Checklist Step 3: Key Steel Pipe and Tube Data Reference Table
Use these benchmark figures from the federal series (base period June 1982 = 100) to audit quote validity during estimate reviews:
| Reference Point | Index Date | PPI Value | Change to September 2026 |
|---|---|---|---|
| Latest Available Month | September 2026 | 431.7 | 0.0% |
| One Month Prior | August 2026 | 429.1 | +0.6% |
| One Year Earlier | September 2025 | 381.3 | +13.2% |
| Two Years Earlier | September 2024 | 360.0 | +19.9% |
| Five Years Earlier | September 2021 | 438.5 | -1.5% |
| Pre-Pandemic Baseline | January 2020 | 270.3 | +59.7% |
| Window High (Jan 2017–Sep 2026) | June 2022 | 508.7 | -15.1% |
Checklist Step 4: Account for Preliminary Data and Four-Month Revision Rules
When using BLS data series, estimators should note that recent monthly index figures are not seasonally adjusted, remain preliminary, and are subject to revision for four months after initial publication. Looking at recent monthly progression reveals a steady upward pattern:
- September 2025: 381.3
- October 2025: 380.1
- November 2025: 380.8
- December 2025: 388.8
- January 2026: 387.3
- February 2026: 393.1
- March 2026: 395.8
- April 2026: 405.7
- May 2026: 410.9
- June 2026: 418.9
- July 2026: 422.1
- August 2026: 429.1
- September 2026: 431.7
Before submitting, walk through your standard bid day checklist to ensure vendor quotes carry guaranteed delivery windows that protect your buyout period while these index values finalize.
Checklist Step 5: Incorporate Escalation Terms on Extended Procurement Cycles
Because the steel pipe and tube index climbed from 387.3 in January 2026 to 431.7 in September 2026, holding firm unit prices across extended schedules exposes subcontractors to procurement risk. To insulate your proposal, tie tube and pipe line items to published price benchmarks or include explicit price escalation clauses referencing commodity index movements. When contracts stretch out over months between bidding and fabrication buyout, identifying published series like BLS series WPU101706 establishes an objective reference for material adjustments.
Sources
U.S. Bureau of Labor Statistics: Series WPU101706 - Steel Pipe and Tube
Published October 31, 2026. No affiliate links on this page. Facts come from the sources linked above; check them for updates.